
IFRS 2 – How to Calculate Fair Value for Share Based Payments
Note: This article is a guest post and its author asked me not to reveal his name, so he stays anonymous.
IFRS 2 Share-based Payment (the “Standard”) is the financial reporting standard dealing with share based payments. It was first introduced in 2005, and is considered to be one of the most complex standards.
One complexity is due to the calculation of share options where vesting is based on a market condition. The definition, under IFRS 2, of a market condition is:
“A performance condition upon which the exercise price, vesting or exercisability of an equity instrument depends that is related to the market price (or value) of the entity’s equity instruments (or the equity instruments of another entity in the same group), such as:
- attaining a specified share price or a specified amount of intrinsic value of a share option, or
- achieving a specified target that is based on the market price (or value) of the entity’s equity instruments (or the equity instruments of another entity in the same group) relative to an index of market prices of equity instruments of other entities.
A market condition requires the counterparty to complete a specified period of service (ie a service condition); the service requirement can be explicit or implicit.”
The standard also states the following for the valuation of options with a market condition:
“Market conditions, such as a target share price upon which vesting (or exercisability) is conditioned, shall be taken into account when estimating the fair value of the equity instruments granted. Therefore, for grants of equity instruments with market conditions, the entity shall recognise the goods or services received from a counterparty who satisfies all other vesting conditions (eg services received from an employee who remains in service for the specified period of service), irrespective of whether that market condition is satisfied.”
Therefore, to value equity instruments with market conditions in accordance with the standard, one must use bespoke complex models to reflect the operation of the market conditions.
In this article we will aim to do the following:
- Explain the background to market conditions under IFRS 2;
- Describe the approach to valuing share based payments with a market condition using an illustrative example;
- Highlight the complexities of the calculation.
Example: Illustration of fair value calculation
Definition of the share option award
Share options (“options”) are the right to acquire a share at some point in the future when certain conditions are met. These are commonly used as part of an incentive plan for employees at publicly listed companies.
Some examples of such schemes at companies are a Long Term Incentive Plan (“LTIP”) or a Performance Share Plan (“PSP”). Under such plans employees receive options, which they can exercise on achieving some pre-defined conditions/targets.
One of the common conditions attached to options is a Share Price or Total Shareholder Return (“TSR”) condition. TSR measures share price growth, but is adjusted to include dividends that are paid on shares.
There is no need to understand how TSR is calculated as this data can be obtained from third parties which track the TSR for publicly listed companies. What is important to understand is that it is a fairly common metric used by companies and, as outlined above, it is treated as a market condition under IFRS 2.
Our example is of a Company that is part of the FTSE 250 index and has granted options to employees on 1 April 2019.
The employees will be able to exercise their options at the end of a 3 year period. The performance condition attached to these options is a relative TSR condition.
At the end of the 3 year period, the TSR of the Company is ranked against the TSR of other companies within the FTSE 250 index (the comparator group). The following table sets out the ranking the Company needs to achieve in order for the options to vest:
| Ranking of the Company | Vesting |
| Median rank | 25% |
| Between median and upper quartile ranking | Straight line interpolation between 25% and 100% |
| Ranking equal to or above the upper quartile | 100% |
The period over which performance is measured is 3 years, commencing on 1 January 2019.
The TSR over the period is calculated by the following formula:
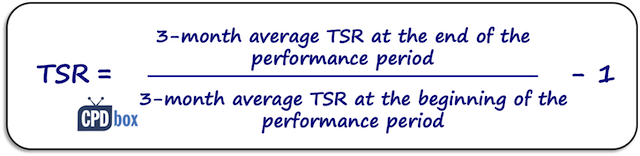
This award requires the employee to provide service in order to receive the options at the end of the 3 years.
This means that the award is clearly within the scope of IFRS 2 and we will need to calculate the fair value of this award to be recognised in the accounts.
Calculation of Fair Value
The above award may seem complicated but this is a fairly typical condition for an LTIP or PSP award in listed companies (with the comparator varying).
In order to calculate the fair value, we need to develop a model that simulates the following:
- The TSR of the company and constituents;
- Determines the ranking of the company (within the comparator group);
- Calculates the vesting.
A Monte Carlo approach will be used, which runs thousands of random simulations based on a set of key assumptions. In each simulation the share price at the end is multiplied by the vesting to determine the value. The final fair value is the average of all the simulations.
This is an acceptable approach under IFRS 2 for this type of market condition.
The calculation process is in two steps:
- Determine a set of assumptions that will be used in the model to value the awards;
- Develop a Monte Carlo model that captures the key features of the award to generate a fair value based on the assumptions in step 1.
Step1: Determine a set of assumptions to feed into the Monte Carlo model
Key point to note: All the assumptions are determined at the date of grant. Any information after this date is ignored for the purposes of determining the value of an equity settled award.
The assumptions needed for the model are as follows:
- Share price – the share price is the starting point for determining the fair value, as this is the value of the underlying equity without any condition, and as such is the maximum value. Typically, this would be the closing share price on date of grant.
- Expected life – the expected life is when the participants are expected to exercise options after vesting. In this scenario, as there is no cost to a participant to exercise the option, we would normally expect a participant to exercise at the earliest opportunity. In this example, the expected life is set equal to the vesting period of 3 years given this is the earliest point at which the options can be exercised.
- Projection period – this is the period in years over which we would project the TSR in each simulation. This is set equal to the remaining performance period at the date of grant. In this example, it would be the period between 1 April 2019 and 31 December 2021 i.e. 2.75 years.
- Risk free rate – this is the rate we would use to project the TSR and normally would be based on the yield of a government bond (as these are deemed to be risk free!) with the term equal to the projection period.
- Volatility – for the Company and comparators.This is determined based on the daily changes in historical share price over a period equal to the projection period. It is important to calculate an annualised volatility assumption as we work in years for the other assumptions. This is a fairly simple calculation with the only tricky element coming from actually obtaining data for all the comparators. For simplicity, we have assumed that there is sufficient share price history for the Company. If this is not the case then there are alternative approaches to determining the volatility, which are beyond the scope of this article.
- Correlation – we also need to allow in our model for the individual correlation of movements in share price between the Company and comparators. The way in which we do this is to calculate the correlation over a historical period equal to the projection period. We then use the individual correlations in our model when simulating the TSR.
- Dividend yield – the starting point for this assumption would be the last dividend paid as a percentage of the share price at grant. However, if the Company feels that this is not the best estimate of future dividends then this can be revised as it is a forward looking assumption. In this example, we would use the dividend yield to discount the share price over the expected life to reflect the fact that participants will not be receiving this income over this period, and therefore the option is less valuable than an ordinary share where shareholders receive dividends.
- Performance to the date of grant – as we need to allow for all information to the grant date, in this example we already know some of the performance of the Company and the comparators (the first 3 months of the performance period from 1 January 2019 to 31 March 2019). The performance to date is then calculated by taking the TSR on 1 April and dividing by the base TSR (which is the 3 month average over the period 1 October 2018 to 31 December 2018).
Step 2: Develop the Monte Carlo model
In this section we will go through the key elements and features of the Monte Carlo model, and where each assumption we have calculated is required. Please note we will not discuss the underlying formulae and theory as it is beyond the scope of this article.
1: Simulating the TSR of the Company and comparators:
- The volatility, risk free rate, correlation matrix, and the TSR to date of grant are used in a share price projection formula alongside a random number to project the TSR of each company over a period equal to the projection period.
- The TSR over the performance period is then the projected and divided by the base TSR.
2: Determining the share price at the end of the of the performance period:
- Starting share price – the share price at grant is used as the base share price in the projection.
- The starting share price is multiplied by the change in TSR
- This share price is then discounted for:
- Risk free rate over a period equivalent to the projection period i.e. 2.75 years
- Dividend yield over a period equivalent to the expected life i.e. 3 years.
3: Determining the payout in a single simulation:
- Determine the vesting percentage in each simulation based on the TSR ranking of the Company relative to the peers and the vesting schedule i.e. if the Company has a median ranking then the vesting would be 25%.
- The share price at the end (calculated above) is then multiplied by the vesting percentage to determine the payout in that simulation.
4: Run 100,000 simulations and use the average payout as the fair value for the award.
The Final Word
As you will appreciate, the calculation using a Monte Carlo model is not simple, and therefore most companies take one of two approaches, both of which involve the use of a third party:
- The third party of experts prepares a valuation report which follows the correct approach under IFRS 2.
- The third party helps the company build a bespoke model for a particular award, which the company then updates assumptions for annually.
The first approach can be costly, especially if you have multiple awards in a year as the price of a valuation would be based on each fair value calculated.
The second approach is cost efficient as it is just a one-off upfront payment. However, if there are multiple awards with slightly different conditions, then a bespoke model for each award would be required.
In addition, if the conditions change from year to year then the models would no longer be fit for purpose. There is also the potential for errors in calculating the underlying assumptions by the end user at the Company due to a lack of expertise or change in personnel.
JOIN OUR FREE NEWSLETTER AND GET
report "Top 7 IFRS Mistakes" + free IFRS mini-course
Please check your inbox to confirm your subscription.
2 Comments
Leave a Reply


Really good article. How can I get in touch with author to find out more regarding the mathematical details of such modelling
I am sorry, can’t reveal based on author’s own wish. He stopped offering advice in this area. Thank you for your understanding.